Data & Analytics | News
Hawaii Goes Public with Growth Model Visualization
- By Dian Schaffhauser
- 01/06/14
A new interactive Web site published by the Hawaii Department of Education lets users click among multiple data streams to compare the state's complex areas, schools, and student groups. The Hawaii Growth Model Visualization Tool, as it's called, generates bubble charts that display how those groups are faring according to two measures: proficiency and growth. (Hawaii organizes its schools into "complex areas," which consists of several "complexes"; each complex is a grouping of a high school, elementary school, and middle/intermediate school.)
The higher a bubble is in the chart, the higher the group's percentage of students scoring in the "Meets or Exceeds Proficiency" range on the state's math and reading assessments. The further to the right in the chart a bubble is, the higher that group's median growth. The location of a student group's bubble from left to right and from top to bottom informs the viewer about growth and achievement for that group at the same time. The size of each bubble indicates group size.
| |
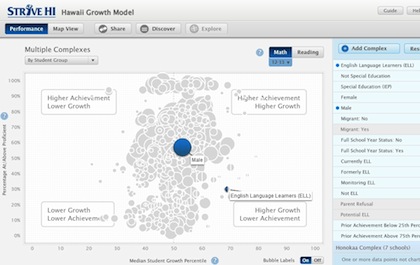
Hawaii's Growth Model Visualization Tool shows what percentage of a group of students are meeting or exceeding proficiency on math and reading assessments, its median growth, and how big the group is at a glance. |
|
The department worked with SchoolView Foundation to develop the visualization tool. SchoolView is a non-profit organization created to coordinate efforts among some two-dozen states to improve data access and data usage about student and school performance within and across states. The SchoolView work uses a student growth percentile (SGP) methodology developed by the Colorado Department of Education and released under a Creative Commons license that allows it to be shared for non-commercial purposes.
Since summer 2013 teachers and staff have been working with a private version of the growth model Web site to analyze student achievement data. The staff site is protected by federal and state regulations from being released publicly. To maintain student confidentiality, users of the public growth model site can't view data for populations of fewer than 20 students.
"The launch of the public Hawaii Growth Model data visualization Web site is an exciting step in the department's journey to provide better information about school performance, in timely, easy-to-access, user-friendly ways," said Deputy Superintendent Ronn Nozoe. "The ability to visualize growth data in context with how a school or complex is performing in relation to others over time is critical to building understanding and collaborative action."
Hawaii's Department of Ed serves approximately 185,000 students.
About the Author
Dian Schaffhauser is a former senior contributing editor for 1105 Media's education publications THE Journal, Campus Technology and Spaces4Learning.