Condition of Education 2022
Report: Historic Decline in U.S. Public School Enrollment From Fall 2019 to Fall 2020; Dropout Rates Fell Since 2010 Among Hispanic, Black Students
More Students Completing Advanced Math, Science Courses Before Graduating High School, NCES Stats Show
- By Kristal Kuykendall
- 05/31/22
Total preK–12 public school enrollment in the United States declined 3% between fall 2019 and fall 2020, erasing a decade of steady growth, according to the National Center for Education Statistics’ 2022 edition of the annual Condition of Education report to Congress, released today.
The drop represented the largest single-year decline in total public school enrollment since 1943, NCES said, and was concentrated in lower grades.
The report also showed that students enrolled are completing more advanced math courses and more science courses, and fewer are dropping out before obtaining their high school diploma or GED, NCES said. The overall status dropout rates fell about 28% over the last decade to 5.3%, and even bigger gains were reported among Hispanic and Black students, whose dropout rates in Fall 2020 averaged about half what they were a decade prior, the report said, at 7.4% and 4.2%, respectively.
The congressionally mandated Condition of Education report includes 88 indicators — 52 of which were updated this year — summarizing the latest data on education nationwide from prekindergarten through postsecondary levels, and it includes workforce outcomes and international comparisons. A federal agency, NCES serves as the statistical center of the U.S. Department of Education and the primary federal entity for collecting and analyzing data related to education in the U.S. and other nations.
PreK–12 Condition of Education Key Findings
The following are the key findings from the Condition of Education Report, for preK–12:
- Between fall 2019 and fall 2020, the total public elementary and secondary school enrollment for prekindergarten through grade 12 students dropped 3, from 50.8 million students to 49.4 million students. This decrease in enrollment during the first year of the COVID-19 pandemic brought enrollment back to 2009 levels (49.4 million), erasing a decade of steady enrollment growth.
- Whereas the 1943 drop — during World War II — was concentrated among public school students in grades 9–12, the 2020 drop was concentrated among those in grades preK–8. Specifically, between fall 2009 and fall 2019, enrollment in preK–8 increased by 3% to 35.6 million before dropping 4% to 34.1 million students in fall 2020. In contrast, enrollment in grades 9 through 12 increased 2% between fall 2009 (15.0 million) and fall 2019 (15.2 million) and continued to increase in fall 2020 (15.3 million).
- Enrollment rates for 5-year-olds fell 6 percentage points to 84% from 2019 to 2020, while enrollment rates for 3- to 4-year-olds fell 13 percentage points, to 40 percent.
- Public charter school enrollment more than doubled between fall 2009 and fall 2019, growing to 3.4 million students in fall 2019. At the same time, the number of students attending traditional public schools decreased by 0.5 million (from 47.5 million to 47.0 million students). As a result of these two concurrent trends, the percentage of all public school students who attended public charter schools increased from 3 to 7% over this period.
- Greater percentages of high school graduates in 2019 than in 2009 had completed algebra II (85 vs. 80 percent), precalculus/mathematical analysis (40 vs. 36 percent), and biology, chemistry, and physics (35 vs. 30 percent). However, the percentage of graduates who had completed calculus was lower in 2019 than in 2009 (16 vs. 18 percent).
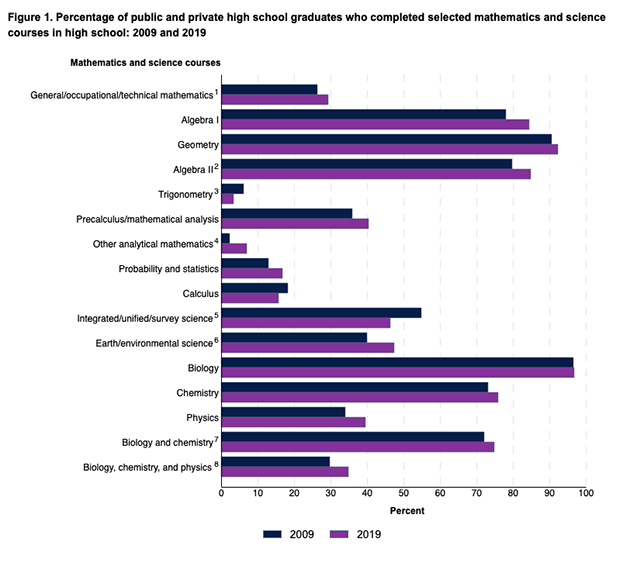
- The percentage of graduates who had completed science courses was higher in 2019 than in 2009 in the following: earth/environmental science5 (47 vs. 40 percent); chemistry (76 vs. 73 percent); and physics (40 vs. 34 percent). In both 2009 and 2019, about 97% of graduates had completed a biology course.
- A higher percentage had completed both biology and chemistry courses in 2019 than in 2009 (75 vs. 72 percent), and a higher percentage had completed courses in all three subjects of biology, chemistry, and physics in 2019 than in 2009 (35 vs. 30 percent).
- The overall status dropout rate decreased from 7.4% in 2010 to 5.3% in 2020.
- The Hispanic status dropout rate decreased from 15.1 to 7.4%.
- The Black status dropout rate decreased from 8.0 to 4.2 percent.
- Status dropout rates for those who were American Indian/Alaska Native, of Two or more races, White, or Asian were not measurably different from the rates in 2010.
- Status dropout rates in 2019 — the year prior to the coronavirus pandemic — did not measurably differ from the rates in 2020 for any racial/ethnic group.
- In 2018–19, public schools spent $13,701 per pupil in constant 2020–21 dollars on current expenditures. This category includes salaries, employee benefits, purchased services, tuition, supplies, and other expenditures. Current expenditures per pupil were higher in 2018–19 than in 2009–10, after adjusting for inflation.
- Total expenditures for public elementary and secondary schools in the United States were $800 billion in 2018–19 (in constant 2020–21 dollars). This amounts to $15,621 per public school pupil enrolled in the fall of that year.
- Total expenditures per pupil were lowest in Idaho ($9,688) and Utah ($10,103).
- Total expenditures per pupil were highest in the District of Columbia ($31,093) and New York ($27,845).
- Of the $15,621 in total expenditures per pupil in 2018–19, current expenditures accounted for $13,701, or 88% nationally. Total expenditures per pupil also included $1,499 in capital outlay.
- Current expenditures per pupil enrolled in the fall in public elementary and secondary schools were 6% higher in 2018–19 than in 2009–10 ($13,701 vs. $12,914).
- Between fall 2009 and fall 2020, the percentage of public school students who were Hispanic increased from 22 to 28 percent. The percentage of public school students who were White decreased from 54 to 46 percent, and the percentage of students who were Black decreased from 17 to 15 percent.
View the full Condition of Education 2022 report at https://nces.ed.gov/programs/coe.
About the Author
Kristal Kuykendall is editor, 1105 Media Education Group. She can
be reached at [email protected].