Edulastic Adds Big-Picture Data Views and Early Warning Features to Data Studio
- By Kristal Kuykendall
- 05/11/23
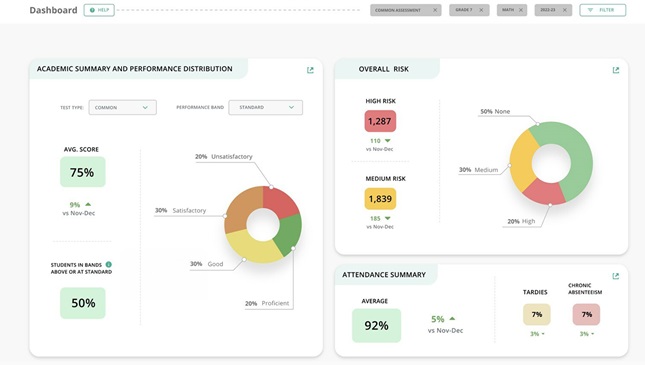
Digital learning provider GoGuardian has added new big-picture data reporting to the Data Studio metrics dashboard within the Edulastic assessment platform, combining student data into overall performance trends and allowing administrators to set goals and receive early warnings when assessment data is trending below those goals, according to a news release.
These capabilities allow administrators to combine student metrics — including attendance, assessment data from multiple platforms such as iReady and NWEA MAP, and more — to help guide instruction and adjust more quickly to performance trends as needed, GoGuardian said.
The new features provide “an even more complete, accessible picture of performance trends, student mastery, and academic risk levels, a task which has proven to be a significant challenge for educators,” GoGuardian said. “This capability is essential as teachers and districts work to recover from pandemic-related unfinished learning, aggregate large data, and personalize charts and graphs to enable Multi-Tiered Systems of Support.”
Educators using Edulastic Data Studio to align and measure MTSS efforts can drill down from district-wide analytics to individual students' data, apply filters to visualize data by student subgroups, strategically apply interventions, and measure progress at various levels, according to the news release.
“Schools have long used a variety of tools to measure student progress, but it has traditionally been a time-consuming and expensive task to combine and view cohesive data, or move between various systems,” GoGuardian said. Edulastic Data Studio can dramatically reduce time spent on pulling data and building ad-hoc reports, the company said.
New reports now available in Data Studio include the Early Warning Report and the Goals and Interventions work flows. The Early Warning Report is found within Edulastic's Whole Learner Report, which “layers attendance data on top of academic data in a central location, enabling teachers to visualize trends, identify important patterns, and plan valuable interventions that move student progress forward.”
The Goals and Interventions features allow schools to “define both academic and non-academic targets and goals, view achievement trends over time, and automatically combine formative and common assessment,” according to the announcement.
Edulastic Data Studio is available as a premium add-on for Edulastic or GoGuardian customers, and it can also be purchased separately.
Learn more at Edulastic.com/data-studio/.
About the Author
Kristal Kuykendall is editor, 1105 Media Education Group. She can
be reached at [email protected].