Educator Survey
Teachers Report Slightly Fewer Students Were Behind in Spring 2022, New Research Shows
April Survey Shows Pandemic's Residual Impact on Instructional Methods, Tools, and the Workforce
- By Kristal Kuykendall
- 06/14/22
New educator survey data from the Christensen Institute released today offers insights into how K–12 teachers are faring, the technology they’re still relying on most, and how the pandemic continues to influence their instructional methods and tools, even with 97% of teachers back to in-person learning.
The latest nationally representative survey was conducted in April and garnered responses from 1,097 teachers representing 1,042 schools across 46 states and the District of Columbia as well as 385 administrators representing 380 schools across 45 states, according to the survey results at the Christensen Institute website.
As teacher burnout soars and more educators than not are planning to leave the field earlier than planned, Christensen’s newest survey focused in part on how teachers feel about their workloads and the challenges of addressing so-called learning loss among students resulting from pandemic interruptions in schools.
The survey also asked teachers and administrators about the style of instruction they’re delivering now, the top curriculum sources they’re using, whether they think their students are still lagging behind typical pre-pandemic academic preparedness levels, and how they feel about their schools’ ability to help those lagging behind to catch up.
Findings: How Teachers are Teaching & Faring
Most teachers reported that they were back in-person in Spring 2022, yet a sizable minority said they prefer hybrid and/or remote instruction — with most of the latter responses coming from teachers who serve mostly students who are historically underserved, according to the Christensen survey reports.
- 97% of respondents said they taught in-person in Spring 2022.
- 85% of all respondents said they prefer in-person to other instructional delivery models, with 9% preferring hybrid and 5% preferring remote.
- Among respondents who teach in high-poverty schools (defined as districts where 20% or more of the students in the district/network qualified for free or reduced meals), 83% said they prefer in-person, 5% prefer hybrid, and 10% prefer remote.
- Among respondents who teach mostly non-white students (defined as 75% of students in the district are not white), 77% said they prefer in-person, 6% prefer hybrid, and 13% prefer remote.
- Overall, neither teachers nor administrators said they regard fully remote, online learning as an effective delivery model, with both groups rating it a 4.3 out of 10, with 10 being most effective.
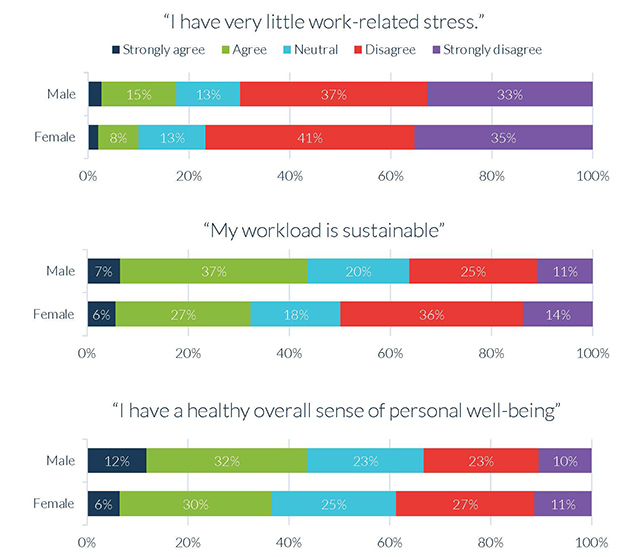
By and large, most of the teachers responding said they have “maintained a healthy sense of well-being” — but male teachers reported better well-being than their female colleagues.
- 70% of male teachers responding said they disagreed to some degree with the statement "I have very little work-related stress," while 76% of female teachers disagreed to some degree.
- Of those respondents reporting they "agree" or "strongly agree" that they have very little work-related stress, 28% were male and 21% were female.
- 50% of female teachers said they disagreed to some degree that their "workload is sustainable," while just 36% of male teachers reported the same.
- 44% of male teachers said they "agree" (37%) or "strongly agree" (7%) that their workload is sustainable.
- 33% of female teachers said they "agree (27%) or "strongly agree (6%) that their workload is sustainable.
The survey asked teachers detailed questions about the instructional delivery models they used in Spring 2022, and 49% of teachers responding said they were using some form of blended learning in Spring 2022 — more than double what was projected during last fall's survey, the report said.
Blended learning is “a formal education program in which a student learns at least in part through online learning, with some element of student control over time, place, path and/or pace, and at least in part in a supervised brick-and-mortar location away from home (such as school),” the study’s authors wrote. “The modalities along each student’s learning path within a course or subject are connected to provide an integrated learning experience.”
The study’s authors inquired about blended learning modalities, as well, defining five models of blended learning as follows:
- Station rotation was defined by the study authors as when students rotate through stations on a fixed schedule, where at least one of the stations is an online learning station.
- Lab rotation was defined as when students rotate on a fixed schedule between teacher-led instruction in class and online learning in a separate room designated for computer-based learning.
- Flipped classroom was defined as when students receive online learning assignments that cover class content for homework, and in-person instruction focuses on discussions, projects, practice problems, etc.
- Individual rotation was defined as when students rotate on an individually customized schedule among online and offline learning activities.
- The Flex model was defined as when online learning is the backbone of instruction. Students move on a flexible, fluid schedule through their learning activities according to their needs and preferences.
The models of blended learning reported being used varied widely between secondary and elementary teachers, the survey showed. However, the report noted that some teachers’ reported classroom practices were inconsistent with the blended learning models they said they'd been using, suggesting that blended learning models are not widely understood.
- 41% of elementary teachers said they were using the station rotation method, while 23% of secondary teachers said the same.
- The second-most used model of blended learning cited by elementary teachers was individual rotation at 13%, followed by flipped classroom (8%), flex (8%), and lab rotation (2%).
- 23% of secondary teachers reported using the flipped classroom method, a tie with station rotation for the most-used model at the secondary level, followed by individual rotation (16%), flex (12%), and lab rotation (6%).
Personalized learning, defined as a broad variety of modalities (including blended learning) that tailor learning and development to the individual student, varied greatly in their reported adoption rates, the findings showed:
- Only 21% of teachers reported using all the personalized practices mentioned in the survey.
- Regular small groups (65%) and student agency (62%) were the most widely used personalized learning practices reported by teachers.
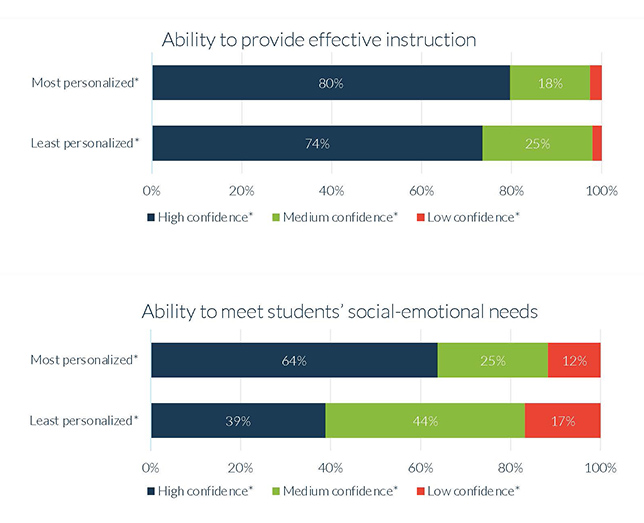
Teachers who used all the personalized practices mentioned in the survey were more likely to feel confident in providing effective instruction and far more confident in meeting students’ social-emotional needs.
Findings: The State of Pandemic ‘Learning Loss’
Teachers are still reporting significant gaps in their students’ learning, but they also said they’ve seen improvement compared to Fall 2021, the survey found. Less than half of respondents said they’re confident their schools can ensure students catch up.
- 72% of teachers responding to the survey classified their students as either "slightly behind" or "behind" the typical pre-pandemic level of academic preparedness, down 8 percentage points from Fall 2021 responses.
- 34% reported their students were "slightly behind" in Spring 2022, unchanged from last fall.
- 38% reported their students were "behind" in Spring 2022, which is 17% fewer than in Fall 2021.
- 20% of teachers said their students were "on track" in Spring 2022, up from 16% in Fall 2021.
- 42% of teachers said they feel "somewhat confident" (33%) or "very confident" (9%) that their schools will be able to help their students recover academically from the pandemic.
- 11% said they feel "very unconfident" about this question, and 23% said they feel "somewhat unconfident."
Tools Teachers Are Using Post-Pandemic
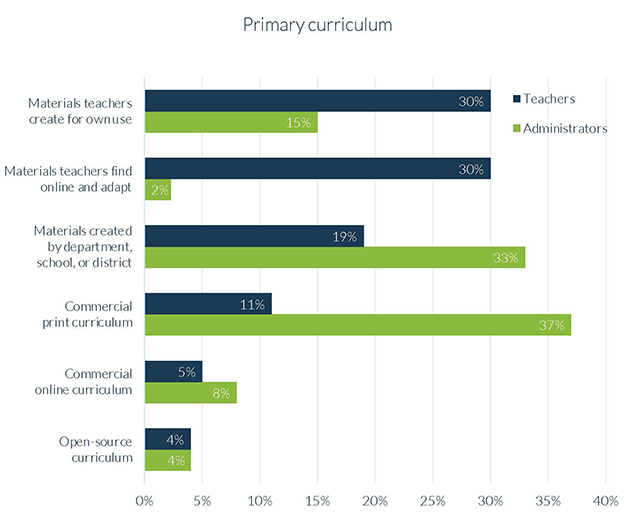
Elementary teachers were most likely to rely on materials they found online, the survey showed, while secondary teachers were most likely to create their own materials as their primary resources.
- 38% of secondary teachers said their primary curriculum sources were materials they'd created for their own use, while 16% of elementary teachers said the same.
- 30% of both elementary and secondary teachers said their primary curriculum sources were materials they found online and adapted.
- 26% of elementary teachers and 13% of secondary teachers said their primary curriculum sources were materials created by the department, school, or district.
Teachers who used materials they created themselves reported being the most satisfied; those who used materials produced by their school system were least satisfied, the survey found. The primary curriculum sources teachers reported using in their classrooms didn’t match what administrators reported as the primary curriculum for their schools.
Although the reported usage of online resources for live video instruction fell significantly since schools returned to in-person learning, teachers’ use of other online resources declined only slightly, the report said. Feedback from teachers included in the report indicated that since the pandemic, teachers are still relying much more on digital LMS platforms and and Google Classroom's automated grading functions now, even if they were available prior to the COVID-19 shutdowns.
- 74% reported using online resources to manage online assignments during Spring 2022, 12 percentage points less than a year prior.
- 72% said they used online resources to administer quizzes or check for understanding, up from 66% a year prior.
- 50% said they used online resources to create online lessons, a decrease of 11 percentage points from a year prior.
- 46% said they used online resources to monitor students' learning progress, unchanged from Spring 2021.
- 30% said they used online resources for live instruction over video, a dramatic decrease from the 84% reporting the same in Spring 2021.
- 26% said they used online resources for individualized or adaptive practice, which was about a third less than the 37% reporting using such resources a year prior.