2016 Salary & Job Satisfaction Survey
The numbers are in for our first annual K-12 IT salary survey. While budgeting frustrations hamper much of IT's work, there's also a sense that the work they're undertaking is important.
- By David Nagel, Dian Schaffhauser
- 01/13/16
$63,776. That's the average annual pay for an IT professional of any rank, type of school or district or years of experience in this salary survey. Whether that sounds low to you or high, keep reading. As we've learned from hundreds of K-12 IT people who have shared details of their jobs, there's more to your work than a single number.
Because this is the first year that THE Journal has developed a salary survey, we lack a baseline against which to compare this year's numbers. (That will come next year.) So we hope you'll weigh in to let us know how close to the mark we came for your own salary and the other job measurements covered in this report.
Average Salaries
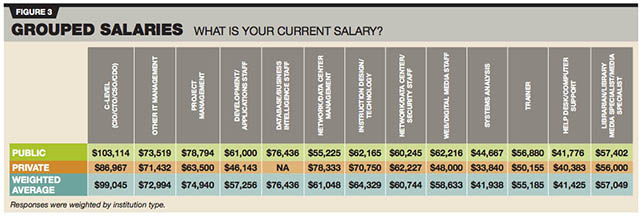
The average weighted IT salary in K-12 didn't vary much between public and private schools. At $63,824, public schools won by a nose against private schools at $63,634. The median (that point that falls exactly between the highest and lowest salaries) was $60,000 for both types of schools.
The smallest salaries were given out to people who work on a help desk or provide computer support. Their average weighted gross earnings were $41,425. On the opposite end of that spectrum were C-level people, the CIO, CTO, CSO or related titles. The average weighted salary for that group of individuals was $99,045. In between those two extremes, the three groups with the highest overall average earnings were:
1. Database and business intelligence staff: $76,436
2. Project management: $74,940
3. IT management: $72,993.50
Wide variations showed up in average salaries based not just on job title but also type of school — public versus private. For example, the highest compensated title in our survey was CIO. The average weighted salary for a CIO at a private school came in at $125,000. It was $98,889 in public school systems, a 21 percent difference. Likewise, a project manager in a public district earned a weighted average salary of $81,136; the same role in a private school earned $56,900 — 30 percent less.
(Click to enlarge.)
The highest salary reported in our survey was $190,000, earned by an IT director at a public district in Indiana. The lowest salary came in at $15,000, recounted by a computer lab manager in New York and a help desk person in Kentucky, both at elementary schools.
To put those incomes into perspective, the average salary for a network administrator within any industry — not just education — was $79,770, according to the Bureau of Labor Statistics reporting for May 2014. If that sounds high to you, keep in mind that the average annual wage for elementary and middle school teachers (arguably the most vital people in any school) in that same reporting period was $57,080. A secondary school teacher earned $59,180 on average. Both of those are less than the reported average in our survey.
Experience and Job Duration
Most respondents (53 percent) have worked in IT for more than 11 years in both public and private schools. A third of people have been on the job between 11 and 20 years. One in 10 has been in IT for two years or less.
Because some individuals have worked at their current schools longer than they've worked in IT, we interpret that to mean that they've taken on IT responsibilities along the way. For example, while 78 percent of individuals have been at their current private schools for between three and 20 years, only 70 percent have been in IT for that same period. In public schools, 73 percent have worked for the same employer for between three and 20 years; but 69 percent have been in IT for the same duration.
Prospects for Growth
While most people (58 percent) working in private school IT said they expected to get a raise in the next 12 months, it's just the opposite at public schools, where only 45 percent anticipate a bump in pay.
"My salary has been frozen for seven years," noted an IT manager in a public primary and secondary school system in Michigan.
A similar sentiment was expressed by an IT manager in a combined public school system in the south: "No raises in Georgia for the last five-plus years, and furlough days due to budget cuts mean I actually make less than I did four years ago."
Also, respondents were overwhelmingly pessimistic about their prospects for advancement in 2016. Only 5 percent of IT people in public schools and 9 percent in private schools predicted a promotion over the next year.
As a technical support specialist for a public high school in Washington asserted, "The issue with IT jobs in schools is there is no opportunity [for] advancement and no increase in pay without advancement. Thus, I make the same now as I did 20 years ago." On top of that, this IT professional added, staff is supervised "by individuals who have no idea of job scope, detail, tasks or really anything else. [It] makes it very difficult when they do not have any clear vision for hiring, hours, overtime, etc. They just want it all to work, period."
In spite of the woes, it should be noted that by and large this isn't a group looking for greener pastures. In public schools 81 percent of people expect to stay put for the next 12 months; in private schools the count is even higher — 86 percent.
"Things are very tight and understaffed; so while demand is high, that is not translating into more jobs, more pay or [a] better work environment," asserted a project manager in a public high school in Iowa. "On the flip side, I have a job, make decent money and there is not much threat of a lay-off; so that is good."
It may be that most people are staying put because they're fairly satisfied with the outlook for the future of IT in K-12. At public school systems, 56 percent of respondents said they expected either "healthy" or "unbridled" growth. Those in private schools are even more hopeful. There, 67 percent indicated they expect growth. A scant 7 percent of people from both kinds of schools foresaw a slow decline or "doom" in their futures.
Overall, those who earned less than the average IT salary were inclined to be a tad more optimistic about the future than those who earned more than the average salary; 62 percent of the former group forecast growth; for the latter group, the count was 56 percent. However, those earning $100,000 or higher were the most optimistic; 66 percent expected healthy or rampant growth.
Job Satisfaction
Nearly eight in 10 people (79 percent) reported feeling satisfied or very satisfied "overall" with their IT jobs in K-12. The highest points of satisfaction, in order, are these:
1. Co-workers (81 percent);
2. Physical comfort (77 percent);
3. Commute (72 percent);
4. Supervisor (71 percent)
5. Working hours (67 percent);
6. Equipment (65 percent); and
7. Benefits (64 percent).
Most people also were fairly happy with the top bosses; 54 percent of respondents were satisfied or very satisfied with the administrators or executives running their school or district operations.
"Enjoy coming to work every day!" declared a project manager in a public combined school system in Massachusetts.
But into every life a little rain must fall. For IT folks in K-12, the drizzle showed up in two areas: salary and department budgets. Thirty-one percent of respondents reported feeling unsatisfied or very unsatisfied with their salaries; 35 percent expressed the same feelings about the IT budget.
Budgetary restrictions are a continual source of vexation for an IT director in a public district in Iowa: "Technology budgets continue to be cut, but demands for integration continue to be pushed. I am forced to maintain more and more technology with less and less help. So the low priority items never get done."
"I love what I do, although I wish I could do more," noted another IT director in a combined public school system in Michigan. "The way we are funded, it doesn't leave much for being able to meet the state and federal requirements in addition to doing all that we need to do to just stay current."
IT as a Calling
Many respondents to the salary survey expressed frustration at having to tackle too much with too few resources. Summarized one media specialist at a public high school in California, "Bandwidth inadequate, [Internet service provider] not investing in solving access issues, admin and teachers not using tech tools to capacity, low skills, no money to train staff or invest in more bandwidth [or] better computers for students."
But underlying those sentiments was also a measure of recognition that the struggle was worthwhile and must continue for the sake of the kids IT serves. As a trainer in a North Carolina public high school summarized, "Biggest issue is determining where to spend limited funds to keep our students competitive."
"It's not for the money!" added a technology associate for a public elementary school in Florida. "We will never make the salary that is offered in the private sector. For those of us who are here long-term, it is a calling to work in public education."
About the Authors
David Nagel is the former editorial director of 1105 Media's Education Group and editor-in-chief of THE Journal, STEAM Universe, and Spaces4Learning. A 30-year publishing veteran, Nagel has led or contributed to dozens of technology, art, marketing, media, and business publications.
He can be reached at [email protected]. You can also connect with him on LinkedIn at https://www.linkedin.com/in/davidrnagel/ .
Dian Schaffhauser is a former senior contributing editor for 1105 Media's education publications THE Journal, Campus Technology and Spaces4Learning.