2018 K–12 IT Salary & Job Satisfaction Survey
With only three exceptions, salaries are up across the board for technology professionals in K–12 education in the last two years. The biggest gripe continues to be (not terribly surprisingly) budgets.

For technology professionals, education has been a rewarding place to work over the last year. Salaries are up for the most part; job satisfaction is high; and the outlook for the future is positive — these according to the results of our third-annual K–12 IT Salary & Job Satisfaction Survey.
Salaries
Overall, the average salary for technology professional in education (excluding classroom teachers) was $66,640 in 2017 — up about $3,000 from 2015 (fig. 1, click to enlarge).
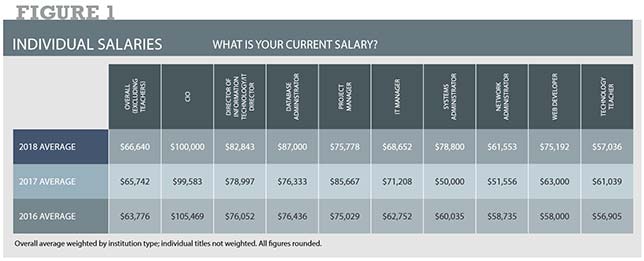
While C-level salaries were up on the whole ($100,400 in 2017 versus $99,045 in 2015), CIO salaries themselves declined from $105,469 in 2015 to an even $100,000 in 2017. That, however, is a slight recovery from 2016's average of $99,583. (C-level includes CIO, CSO, CTO and CDO.)
Project managers and help desk/support staff salaries took a hit in this year's survey as well. Project managers declined to $70,636, down from $74,940 in 2015. Help desk/support fell slightly over the same period, from $41,425 to $40,410.
The most substantial positive jumps over the two-year period were:
- Systems administrators, who leapt more than $18,000 — from $60,035 to $78,800;
- Web developers, who climbed $17,000 from $58,000 to $75,192; and
- Database administrators, who jumped nearly $13,000 from $76,436 to $87,000.
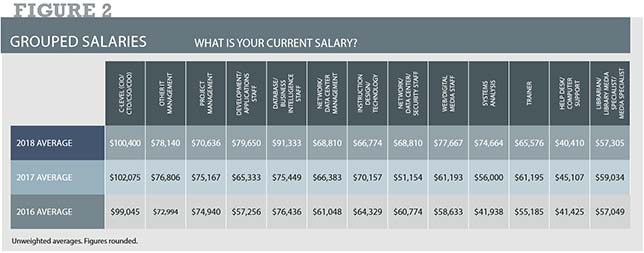
In the broader categories (fig. 2, click to enlarge), several even more substantial jumps were seen over the last two years.
- The average for those in systems analysis went from $41,938 in 2015 to $74,664 in 2017, a gain of more than $32,000;
- Applications and development staff saw an increase of $22,000, from $57,256 in 2015 to $79,650 in 2017;
- Web/digital media staff rose about $19,000, from $58,633 to $77,667; and
- Database/business intelligence staff rose almost $15,000, from $76,436 in 2015 to $91,333 in 2017.
Respondents from the smallest schools or systems (0–499 students) had the lowest overall weighted average salary, at $59,456 ($58,874 at small private schools, $59,731 at small public schools). Employees at the largest schools (3,000 or more students) had the highest weighted average salary: $79,552 ($77,742 private, $80,300 public).
Elementary schools had the lowest salaries on average — $60,161 for tech pros in public elementary schools (excluding teachers) and $52,700 in private elementary schools. The average for public secondary schools was $62,604 and, for private secondary schools, $62,926. Those at public combined elementary came in at an average of $73,225. Private combined schools came in at an average tech salary of $70,206, excluding teachers.
Job Satisfaction
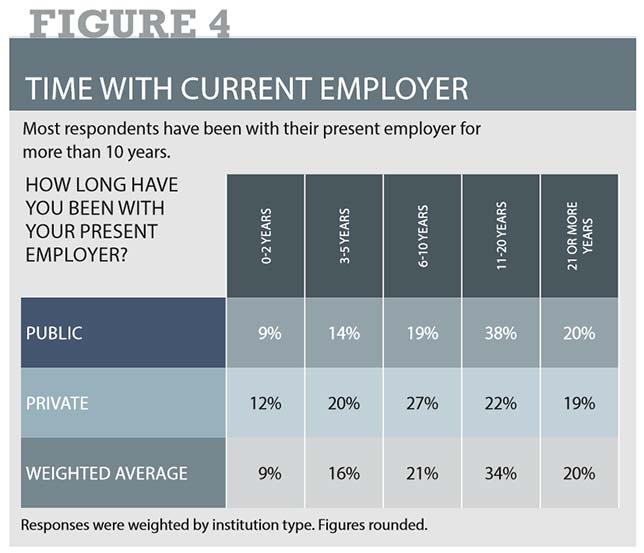
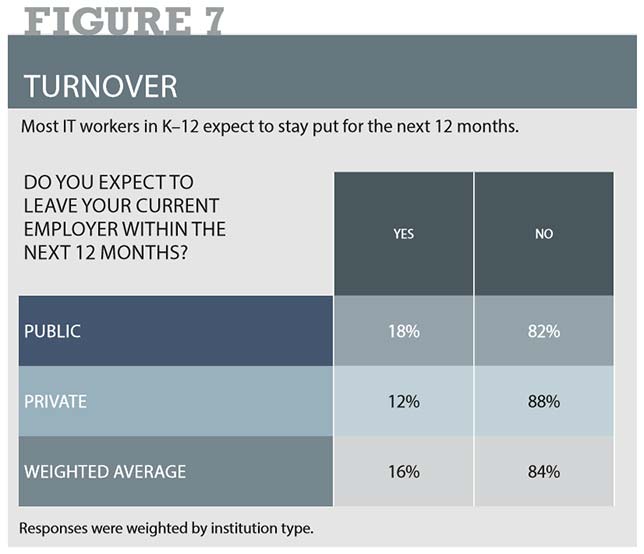
Technology professionals in education are, for the most part, quite satisfied with their jobs. About 84 percent plan to stay in their current position in the coming year (fig. 7), with just 16 percent expecting to leave their current employer. That's not terribly surprising, given that a majority of respondents have been with their present employer for 11 or more years, with a full 20 percent at 21-plus years (fig. 4).
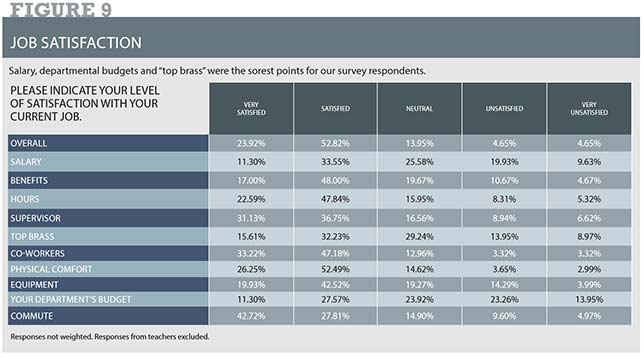
Overall, more than three-quarters (77 percent) are satisfied or very satisfied in their jobs (fig. 9, click to enlarge), with just 9 percent unsatisfied or very unsatisfied.
So what do tech pros like the most?
- Co-workers received the highest satisfaction rating, at 80 percent either satisfied or very satisfied;
- Physical comfort came in second at about 79 percent;
- Commute came in at a 71 percent satisfaction rating;
- Hours were fourth at 70 percent; and
- Rounding out the top 5, supervisors received a satisfaction rating of 68 percent.
Only three aspects of the job received dissatisfaction ratings greater than 20 percent:
- Departmental budgets, with 37 percent of respondents being either dissatisfied or very dissatisfied;
- Salary (somewhat surprisingly), with 30 percent dissatisfaction; and
- "Top brass," with a 23 percent dissatisfaction rating.
Looking Ahead
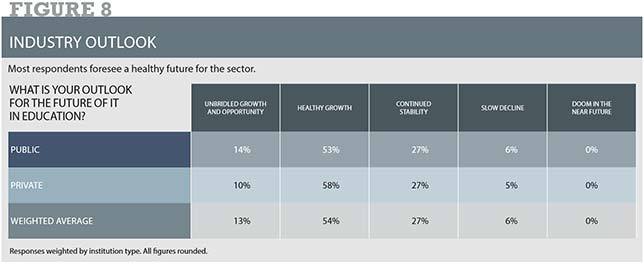
The outlook in technology in the K–12 education sector is positive. More than two-thirds of respondents said they expect to see healthy or unbridled growth and opportunity in the future (fig. 8, click to enlarge). Another 27 percent predicted continued stability. Just under 6 percent said the sector is in a slow decline. And, for the first time in this survey, zero respondents predicted doom in the near future.
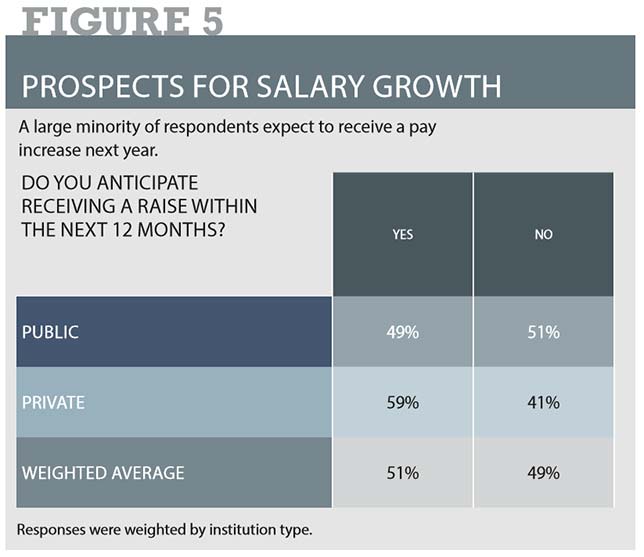
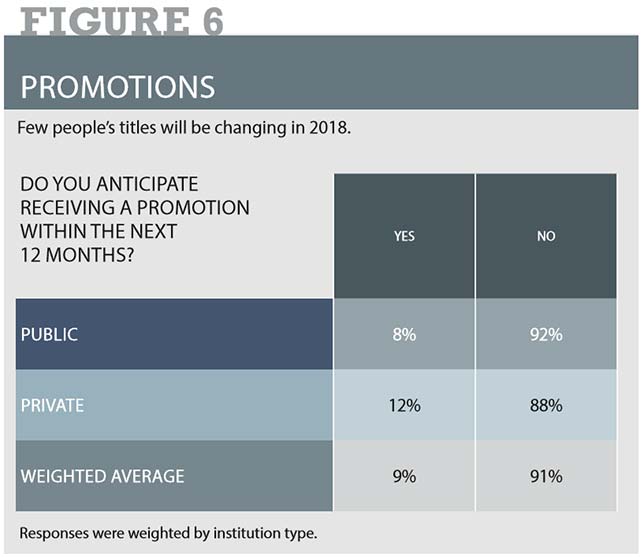
A majority of our respondents said they expect to receive a pay raise (fig. 5) in the next year (51 percent), though the vast majority (91 percent) said they won't receive a new title to go along with it (fig. 6).
Methodology
THE Journal polled its readership in the summer and fall of 2017. We put out an open invitation to IT professionals in education and incented them to participate with a $250 Amazon gift card as a prize for one randomly selected winner and promised confidentiality for respondents. The survey was advertised on thejournal.com and in newsletters and e-mail promotions to our subscriber list, and recipients were asked to encourage colleagues to participate as well.
We received 490 completed surveys. Responses were manually culled that were clearly false or inappropriate for the survey. (For example, several higher ed IT staffers responded to the poll; their answers were excluded, as were responses from faculty members and non-IT staff and administrators except those who held dual positions in technology.)
The final tally for qualified respondents was 338, of which 326 were from public institutions, the rest from private institutions.
Where noted in the figures accompanying this article, vetted responses from qualified public and private institutions were weighted by institution type to be representative of the nation as a whole based on data from the United States Department of Education.
We also asked for, but did not weigh against, geographic location and size of the institution's student body.
Geographically, our respondents tracked somewhat closely with ED's regional data for K-12 institutions (using census regions), with the East South Central region the only significantly overrepresented area. New England: 6.8 percent; Mid Atlantic: 11.8 percent; East North Central: 14.2 percent; West North Central: 6.8 percent; South Atlantic: 30.2 percent; East South Central: 8 percent; West South Central: 8.8 percent; Mountain: 5.9 percent; and Pacific: 7.4 percent.
The breakdown in student body size among vetted respondents was: 0-499: 19.8 percent; 500-999: 26.7 percent; 1,000-1,499: 15.4 percent; 1,500-1,999: 5.3 percent; 2,000-2,999: 7.4 percent; and 3,000 or more: 25.4 percent.
The survey consisted of 14 questions, 13 of which were mandatory. A final open-ended question asking for additional comments was optional, though nearly one-quarter of the qualified respondents (23 percent) chose to add their two cents.