2017 IT Salary & Job Satisfaction Survey
The results are in for our second-annual survey of IT pros working in K–12 schools and districts. For the most part, tech leaders are doing well in their professions and see a bright future for the industry.
Salaries are up, and so is the level of optimism for the
future among IT pros in K–12 education. According to
THE Journal's second-annual IT Salary & Job Satisfaction Survey, the overall average salary for IT leaders and
workers grew about $2,000 year over year. The vast
majority also told us they see nothing but healthy or even unbridled growth in the future for IT in academia.
Salaries
The overall average salary for IT professionals in education — excluding teachers who have a dual role in technology — came in at $65,742. (See figure 1.) That's roughly $2,000 higher than last year's overall average. (If we include teachers who participated in the survey, the average comes down a bit to $64,499, but still higher than last year's overall average of $63,776.)
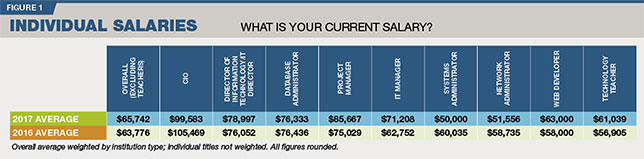
Click image for larger version.
C-level leadership remains at the top of the salary heap, averaging about $102,000 — up about $3,000 from last year. Other IT leaders, including directors, vice presidents, managers and the like, came in second at an average of $76,806, an increase of about $3,800 over last year's reported average. Coming in third were database/business intelligence staff at $75,449, a drop of about $1,000 from last year.
The only grouped category (figure 2) to see a decline this year besides database/business intelligence staff was network/data center/security staff, which fell off by a whopping $9,600 to land at $51,154.
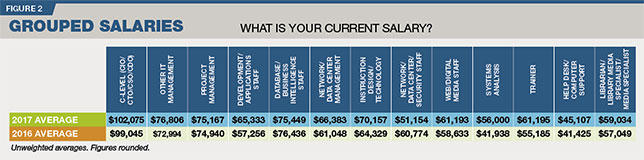
Click image for larger version.
The most substantial year-over-year gains were seen by developers, systems analysis staff and trainers. Technology trainers' average salary climbed about $6,000 to hit $61,195 this year. The average salary for K–12 software developers jumped more than $8,000 to $65,333. But systems analysis staff, which included analysts and senior analysts, left them both in the dust, jumping more than $14,000 to reach $56,000. (See figure 2.)
There was a near-linear progression in overall unweighted average salaries based on institution size, with smaller institutions generally seeing lower salaries than large ones. The exception, as with last year's results, was the category of schools with 2,000 to 2,999 students, in which salaries came in lower than those of IT pros in smaller institutions.
Excluding salaries from respondents with "teacher" in their job description, the smallest schools (those with fewer than 500 students) had an average reported IT salary of $54,116 ($55,755 with teacher salaries averaged in); in schools with 500 to 999 students, the average IT salary was $55,900 ($55,356 with teacher salaries); in schools with 1,000 to 1,499 students, the average salary was $66,256 ($65,191 including teacher salaries); in schools with 1,500 to 1,999 students, the average was $73,804 ($69,469 including teachers); in schools with 2,000 to 2,999 students, the average IT salary was $66,840 ($69,583 with teachers); and in schools with 3,000 or more students,
the average was $78,831 ($77,725 with
teachers factored in).
Job Satisfaction
Overall, this year's participants indicated that they're pretty satisfied with their careers. About 75 percent were either satisfied or very satisfied with their current positions. In particular, K–12 IT people are happy with their:
- Physical comfort (83 percent satisfied or very satisfied);
- Co-workers (79 percent);
- Hours (75 percent);
- Commute (73 percent);
- Supervisor (71 percent);
- Equipment (71 percent); and
- Benefits (62 percent).
Areas that could use some improvement? Salary, departmental budgets and "top brass."
Among our respondents, about
46 percent said they're satisfied or very satisfied with their salaries, while 33
percent were dissatisfied or very dissatisfied. Forty-nine percent were positive about the top brass in their organization, while 22 percent were dissatisfied or very dissatisfied. One surprising category was departmental budgets, with 34 percent dissatisfied or very dissatisfied and 47 percent satisfied or very satisfied. (See figure 9.)
Click image for larger version.
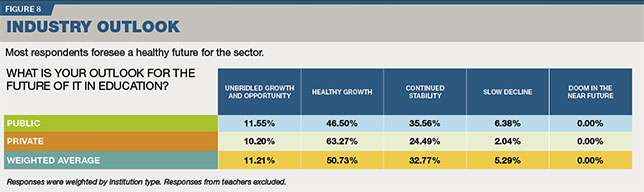
While respondents in last year's survey were on the whole optimistic about the future of their profession, respondents this year are wildly so. Nearly 95 percent said they foresee either
continued stability (32.77 percent), healthy growth (a massive 50.73 percent) or unbridled growth and opportunity (11.21
percent).
Looking Ahead
None of our respondents predict doom for the industry in the near future, and only 5.29 percent are predicting a
"slow decline." (See figure 8.)
Most (91 percent) indicated that they do not anticipate
receiving a promotion in the next year, but about half (51.92 percent) said they expect a raise. (See figures 5 and 6.)
The bulk of our respondents are long-timers and have been with their present employer for 11 or more years. About 36 percent have stayed put for 11 to 20 years, and another 20.5 percent have been in place for 21 or more years. So it's not
surprising that the vast majority (81 percent) of respondents to this year's survey indicated they expect to stay where they are for at least another 12 months. (See figure 7.)
Methodology
THE Journal polled its readership in the months of October, November and December 2016. We put out an open invitation to IT professionals in education and incented them to participate with a $250 Amazon gift card as a prize for one randomly selected winner and promised confidentiality for respondents. The survey was advertised on thejournal.com and in newsletters and e-mail promotions to our subscriber list, and recipients were asked to encourage colleagues to participate as well.
We received 430 fully completed surveys. Responses were manually culled that were clearly false or inappropriate for the survey. For example, some higher ed IT staffers responded to the poll; their answers were excluded, as were responses from principals, vice principals and other non-IT staff and administrators except those who held dual positions in technology. Those who responded with patently unrealistic salaries were also eliminated. A small number of teachers completed the survey. Of those, many were either technology educators or educators who held dual roles in technology support or instructional design. Their responses were included where noted.
The final tally for qualified respondents was 379, of which 331 were from public institutions (71 elementary, 97 secondary, the remainder combined or district-level); 48 were from private institutions (12 elementary, 12 secondary, the remainder combined or district-level).
Vetted responses from qualified public and non-profit institutions were weighted by institution type to be representative of the nation as a whole based on data from the United States Department of Education. In some cases, weighting was not possible (as in the case of individual job titles). However, as our sample was fairly close to reality, weighting did not have a large impact on averages.
We also asked for, but did not weigh against, geographic location and size of the institution's student body.
As with last year's survey, geographically, our respondents tracked closely with ED's regional data for K-12 institutions (using census regions). New England: 4.75 percent; Mid Atlantic: 10.82 percent; East North Central: 11.35 percent; West North Central: 6.33 percent; South Atlantic: 27.7 percent; East South Central: 8.71 percent; West South Central: 12.93 percent; Mountain: 5.54 percent; and Pacific: 11.87 percent.
However, also as with last year's survey, student body size among our participants tended to be on the larger side than would be representative of the nation as a whole. The breakdown in student body size among vetted respondents was: 0-499: 19.2 percent; 500-999: 24.9 percent; 1,000-1,499: 11.3 percent; 1,500-1,999: 6.3 percent; 2,000-2,999: 7.6 percent; and 3,000 or more: 30.7 percent.
The survey consisted of 14 questions, 13 of which were mandatory. A final open-ended question asking for additional comments was optional.