How States Compare on STEM Education
A new interactive national report shows how states are performing based on 10 different STEM benchmarks.
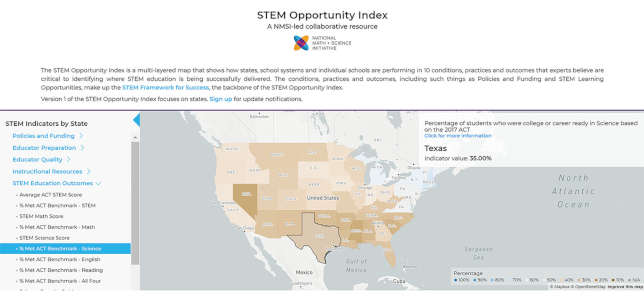
The STEM Opportunity Index, developed by the National Math and Science Initiative, SRI International and 100Kin10, looks at more than 100 public data sets and puts the results into an interactive map that compares how states are doing across 10 different conditions, practices and outcomes that demonstrate STEM success rates.
These indicators include policies and funding, teacher preparation, educator quality, instructional resources and STEM education outcomes. Data sets incorporated into the map include Next Generation Science Standards and ISTE standards adopted, proficiencies in math and reading for fourth and eighth graders from the National Assessment of Educational Progress and ACT test benchmark scores in STEM, science, English and reading.
Each of the indicators come from the STEM Success Framework, which is a guide help to states and school districts navigate equitable STEM teaching and learning. The framework consists of three sections: system contributors, conditions and practices and STEM outcomes.
"No one organization can ensure all students have the access and resources needed to thrive in STEM education," NMSI CEO Bernard Harris said. “We now look forward to adding more features and seeing how businesses, lawmakers, parents and other nonprofits use the tools to improve public STEM education."
NMSI said that by the end of the year school system and school-level data will be added to the STEM Opportunity Index.
The index can be accessed online now.
About the Author
 Sara Friedman is a reporter/producer for Campus Technology, THE Journal and STEAM Universe covering education policy and a wide range of other public-sector IT topics.
Friedman is a graduate of Ithaca College, where she studied journalism, politics and international communications.
Friedman can be contacted at [email protected] or follow her on Twitter @SaraEFriedman.
Click here for previous articles by Friedman.