Federal Per-Pupil Spending Map Gives Rundown for Each School and District
- By Dian Schaffhauser
- 10/06/20
The
United
States
Department of Education
has launched an interactive
map
that shows how much money each school spends per student. So far,
districts and schools in 20 states have been added to the map.
The
idea, according to the agency, is to "radically increase
transparency as parents and local leaders seek to understand funding
levels and differences between schools." ESSA, the Every Student
Succeeds Act, requires each state to provide the data on "per
pupil expenditures" as part of its public "report card"
for each education agency.
Agency
Secretary Betsy DeVos suggested in a press release that because
states provide the information "in different ways and places —
some more transparently than others," it was up to the
Department to make the state data "more easily accessible and
searchable."
Map
results provide a rundown on federal, state and local funds that make
up the per-pupil expenditure (PPE) for each school and district
starting with the 2018-2019 school year — the first year in which
the data was required to be reported. The tool provides the map,
individual state pages and downloadable Excel files.
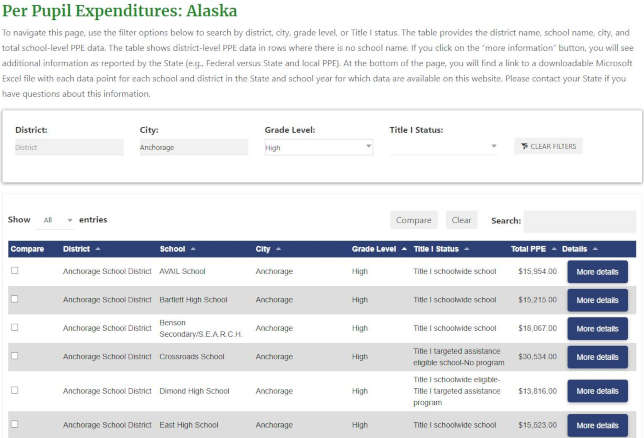
Users
can search for individual districts and schools or filter by
district, city, grade level and Title I status and do comparisons
within individual states.
"Parents
are increasingly attuned to how their schools are — or aren't —
meeting their students' needs," said Secretary DeVos, in a
statement. "They need tools to advocate for reforms, and good
decision-making requires transparent, actionable information that,
unfortunately, isn’t always easy to find. That’s why we've
committed ourselves to fixing that. This new web tool clearly
displays per pupil student funding at the building level so parents
can see how their money is being spent on students. This is the level
of transparency that states and districts should aspire to and that
parents deserve."
The
agency said that the tool would be updated as additional data became
available.
The
map is openly available on
the Department's website for the Office of Elementary & Secondary
Education.
About the Author
Dian Schaffhauser is a former senior contributing editor for 1105 Media's education publications THE Journal, Campus Technology and Spaces4Learning.