CoSN Survey of IT Leaders Shows Ransomware Underestimated, Cybersecurity Still Woefully Understaffed
- By Kristal Kuykendall
- 05/20/22
The Consortium on School Networking’s latest State of Ed Tech Leadership Survey reveals that despite warnings from multiple agencies and rising incidents of ransomware attacks targeting K–12 schools, IT leaders continue to underestimate the risk of ransomware to their districts, with only 8% of respondents rating ransomware as a “high risk.”
The survey, conducted in February by MCH and K12 Insight, included responses from more than 1,500 IT professionals in public schools, according to the report recently released by CoSN.
The survey results also showed that school districts’ IT departments remain understaffed, particularly in providing remote support for students and staff and in managing cybersecurity risks, the report said, with just 21% of districts reporting they have a dedicated full-time employee overseeing cybersecurity.
Additionally, amid existing workforce shortages for K–12 IT staff, nearly a third of respondents said they plan to retire within in the next five years, CoSN said.
Key Findings: Infrastructure
K–12 IT priorities have changed during the COVID-19 pandemic, the report noted. “Capacity to run video conferencing software has become a mandatory requirement for new device purchases used in education” and the number of respondents reporting challenges related to video conferencing has fallen since last year. “More than three-fourths of respondents are prioritizing devices that are Wi-Fi 6 enabled, and the vast majority have replaced BYOD (bring your own device) strategies with school-provided 1:1 strategies, even in the elementary grades,” CoSN said. “To address off-campus connectivity, most districts are now providing district-owned Wi-Fi hotspots for students who lack connections at home.”
- 84% of devices on respondents’ network are district-owned.
- Only 4% of respondents said district-owned devices comprise 50% or less.
- Middle schools have the highest rate of 1:1 implementation with 86%, followed by high schools with 83%; grades 3–5 is 81%; grades K–2 is 73%.
- 5% of respondents said all their students have adequate broadband access at home; 7% reported most of their students have adequate access at home.
- 41% of respondents reported that only 10% of their students don’t have access to broadband at home.
- 10% said 31-50% of their district’s students don’t have home broadband.
- 33% said 11-30% of their district’s students don’t have home access.
- 81% of districts employ a variety of strategies to help students access broadband at home:
- The most popular method is providing Wi-Fi hotspots, reported by 67% of respondents.
- 10% partner with libraries to provide loaner hot spots.
- 33% promote federal broadband benefit programs for low-income families.
- 24% promote provider-sponsored services at reduced monthly rates.
- 19% provide free or subsidized access to low-income families directly.
- 14% provide Wi-Fi on school buses.
- 55% of districts have a 1 Gbps typical connection speed between the wireless access point and the local area network.
- 4% of districts have multiple 1 Gbps.
- Slower speeds of 100 Mbps were reported by 17% of districts with 2% reporting a speed of just 10 Mpbs.
Key Findings: Cybersecurity
- 21% of districts have a full-time equivalent employee dedicated to network security, the same percentage as last year’s survey, CoSN said. “This means that cybersecurity protection is a part-time responsibility in a large majority of school districts.”
- 34% said cybersecurity management is handled with a “shared-responsibility approach in which cybersecurity functions are carried out by more than one employee,” compared with 53% in the 2021 survey.
- 21% of districts outsource cybersecurity management:
- 7% to a public service organization through local or state government or a school district cooperative entity
- 14% to a private sector provider
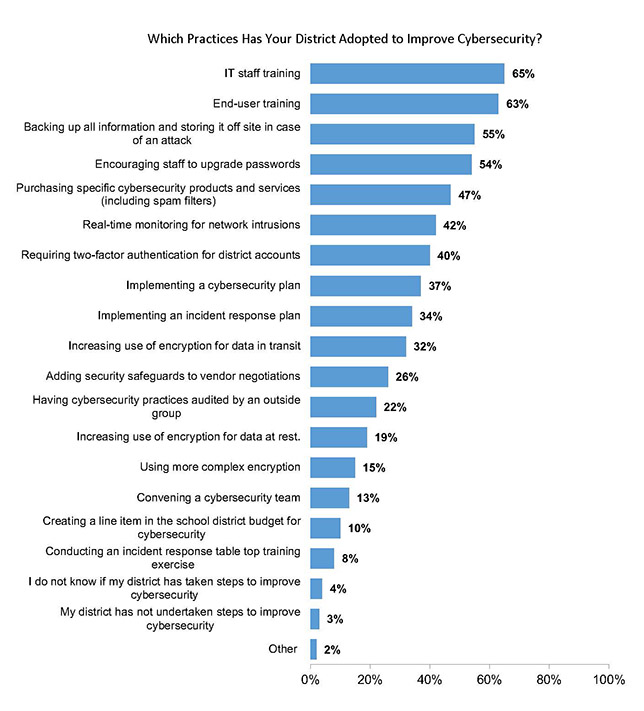
- 65% used IT staff training and 63% reported using end-user training to improve cybersecurity.
- 55% employ the best practice of offsite backups.
- 54% encourage staff to upgrade their password.
- 30% of districts don’t require any cybersecurity training for their teachers, administrators, or staff.
- Threats from outside hackers and ransomware attacks were assessed as low or low/medium risk by 37% of districts, compared to 42% rating threats from students and staff (including human error) as low or medium/low risk.
- Only 12% rated phishing scams as high risk to their network security.
- Less than one in ten (8%) of respondents feel they are at high risk for a ransomware attack.
- In assessing their own ability to address cybersecurity issues, 47% felt somewhat prepared, almost a third (32%) felt mostly prepared, and 12% felt very prepared. Only 3% felt extremely prepared.
- 62% of districts purchase cybersecurity insurance, and another 3% are planning to purchase.
Key Findings: Procurement & Interoperability
- 52% of IT professionals surveyed have “heavy involvement” in the procurement of digital instructional materials, including 19% who serve as the final decision-maker. Another 22% are part of the team that evaluates purchases.
- 53% of districts have more than half their instructional materials in digital format. Just 21% of districts have more than 75% digital.
- 78% of districts have processes in place for reviewing and allowing the introduction of free tools into their digital ecosystems; a review by the IT department is required by 56% of districts represented in the survey.
- 22% of districts don’t have any processes in place for reviewing free tools.
- 82% of districts said a lack of interoperability affects operational efficiency.
- 48% of districts said that work-arounds such as manual data entry, extract, transform, load procedures, data flat file exports/imports, FTP and other data sending/transferring methods affect their operational efficiency at least moderately, including 12% who said it affects efficiency to a large or extremely large degree. About a third said they are are impacted to a small degree.
Key Findings: IT Staffing, Demographics, & Salaries
IT leaders are still overwhelmingly white and predominately male, CoSN said in its report. “A slight majority of men come to their position with a technical background, compared to less than a quarter of women,” the report said. “Conversely, nearly three-quarters of women IT Leaders have professional backgrounds in education compared to less than half of men.”
- 31% of IT leaders said they are planning to retire in the next five years, with 9% of those being in their forties currently.
- 69% of IT leaders are in their 40s and 50s.
- 85% of IT leaders responding said they identify as White, Caucasian, or European.
- 4% identify as Black, African American, or Sub-Saharan African.
- 4% identify as Hispanic/Latino/Latina/Latinx.
- 34% of IT leaders responding were women, an increase from 25% two years ago.
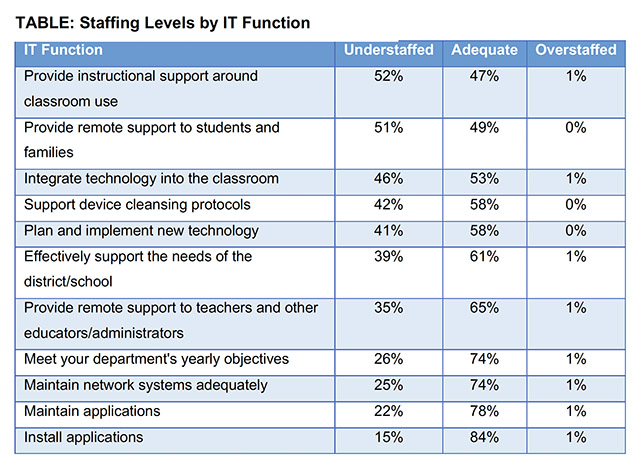
- 52% said their districts were understaffed for providing instructional support around classroom use.
- 51% said they were understaffed for providing remote support to students and families.
- 46% of respondents reported insufficient staff for integrating technology in the classroom.
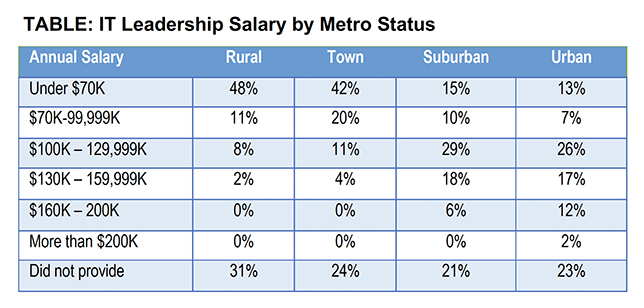
When it comes to salaries, there’s a distinct metro divide. IT Leaders working in towns and rural districts are largely in the lower end of salary ranges and largely missing at higher end.
- 59% of IT leader salaries in rural areas are under $100K, with 48% below $70K.
- 62% of IT leader salaries in towns and smaller cities are under $100K, with 42% below $70K.
- 25% of IT leader salaries in suburban areas are under $100K, with 15% below $70K.
- 20% of IT leader salaries in urban areas are under $100K, with 13% below $70K.
- 2% of IT leader salaries in rural areas and 4% in urban areas are at least $130K.
- 24% of IT leader salaries in suburban areas and 31% in urban districts are at least $130K.
- Respondents from urban districts were the only segment to report IT leader salaries of over $200K, representing 2% of those surveyed.