NAEP Test Results Show Kids Backsliding in Math and Reading
- By Dian Schaffhauser
- 10/29/15
If the United States were a parent, its older kid would probably be facing a stern talk about now, even as the parent was remembering just how poorly it did on testing in school way back when. National average NAEP scores for mathematics and reading were lower in 2015 than 2013 for eighth-grade students; 22 states saw declines in results. Yet scores were still higher than the first assessments in the early 1990s at both grades 4 and 8.
NAEP, the National Assessment of Educational Progress run by the United States Department of Education's National Center for Education Statistics (NCES), tests representative samples of students in public and private schools every two years on a number of subjects. The latest results for tests taken six months ago reflect scores in reading and mathematics for fourth and eighth graders.
In reading, while the average reading score for fourth-grade students didn't change in comparison to 2013, eighth-grade students scored lower.
In 2015 on separately developed 0-500 point scales, students had an average score in reading of 223 points at grade 4 and 265 points at grade 8. The 2015 average score wasn't significantly different at grade 4 and was two points lower at grade 8 compared to 2013. The 2015 results are still better for both grades than those from the earliest reading assessments in 1992 by six points at grade 4 and five points at grade 8.
Those students eligible for the national school lunch program (a proxy for poverty) were higher in 2015 for fourth graders and lower for eighth graders when compared to 2013.
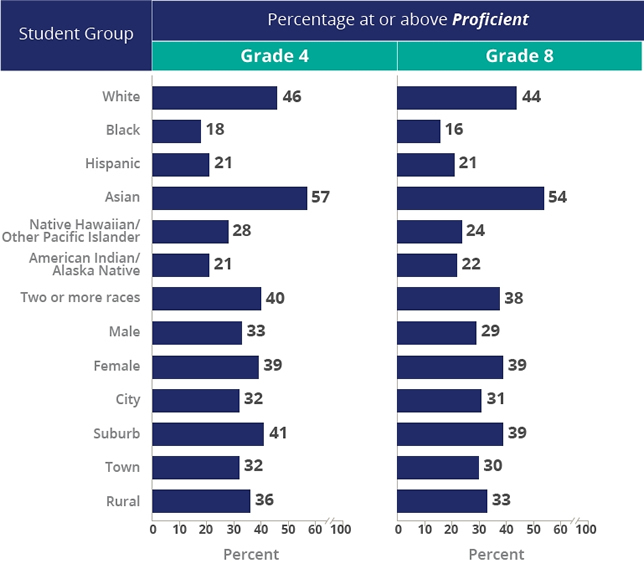
Besides the scale scores, results are also broken out by three achievement levels: basic (a cut score in reading this year of at least 208 for fourth graders and 243 for eighth graders), proficient (a score of at least 238 for fourth graders and 281 for eighth graders) and advanced (a score of at least 268 for fourth graders and 323 for eighth graders). In grade 4 36 percent of students scored at or above proficient. The count was 34 percent for grade 8 students.

In the subject of mathematics both groups of students scored lower this year than in 2013. Those scores were higher, however, than in 1990.
Using separate 0-500 scales, fourth graders in 2015 had an average math score of 240 points. It was 282 points for eighth graders. Those were one and two points lower, respectively, than average scores in 2013. In 1990, when the earliest math assessments were given, the scores were lower by 27 points for fourth graders and 20 points for eighth graders.
In grade 4 this year 40 percent of students scored at or above proficient. That was 33 percent for grade 8 students.
More extensive results, along with a state-by-state analysis, are available on the Nation's Report Card Web site.
As testing results surface from the new assessments tied to the Common Core state standards, NAEP is also doing the work of developing a "common metric" by which state test results can be compared to NAEP results. Because states use different standards for defining what's meant by "proficiency," the state standards can't be compared directly. So NAEP has developed what it calls a "NAEP scale equivalent score," which is the point on the NAEP metric at which the state's proficiency level is set for an equivalent percentage of students. As explained in a blog article on the NAEP site, a given state may find that 71 percent of students scored at or above proficiency in a given subject and grade. On the NAEP scale, 71 percent of students may have scored at 243. So 243 is set as the NAEP scale equivalent score. That score will differ from one state to the next.
Right now the focus appears to be on the rigor of state assessments and how they define what's meant by "proficient." When examined in that regard, the number of states with grade 4 reading standards at or above the NAEP basic level increased from 20 in 2011 to 25 in 2013. (The analysis hasn't been released for 2015 results.) Standards from only two states met the proficient level. At grade 8, the number of states with reading standards at or above the NAEP basic level increased from 36 in 2011 to 41 in 2013 (with only one state having a standard in the proficient range in 2013).
For math, the number of states with grade 4 standards at or above the NAEP basic level increased from 46 in 2011 to 47 in 2013; five states had standards in the proficient range in 2013. For grade 8 41 out of the 49 states included in the study had standards above the NAEP basic level, an increase from 39 in 2011; three state standards were above the proficient level.
The complete results for that mapping effort are documented in this report on the NCES site.
The comparison of state to national standards isn't a topic that will disappear any time soon. As Achieve President Michael Cohen stated, "It appears that there is a mismatch between NAEP and all states' math standards, no matter if they are common standards or not." Achieve is a national non-profit created by a bipartisan group of governors and business people to focus on raising academic standards. The organization was heavily involved in the creation of the Common Core. Cohen noted that a recent analysis done by the American Institutes for Research of states without common standards showed that NAEP is testing on some math standards that don't appear until later grades in those states.
His advice: "The National Assessment Governing Board, which oversees NAEP, should carefully review its frameworks and assessments in order to ensure that NAEP is in step with the leadership of the states."