Learning Analytics Can Be Deceiving
Data. Big data. Really Big Data. If there is anything iconic about the Internet, it is the Really Big Data that are generated, 24/7, as a "byproduct" of our constant use of the Internet. Facebook’s 2.27 billion monthly active users generate 500+ terabytes of data each day. (FYI: There are 12 zeros in 1 terabyte.) The Internet generates 2.5 quintillion bytes of data per day. (FYI: There are 18 zeros in 1 quintillion.) Check out this infographic — Data Never Sleeps 5.0 for some mind-boggling numbers.
Interestingly, of course, it is the byproduct — that Really Big Data — resulting from our use of Internet that brings in the billions and billions of dollars. Advertisers — and we have recently learned, "bad actors" — mine those data so as to target just the right group who might want a new kind of underarm deodorant!
And now, with the evolution of the Internet of Things (IoT) — and cheap sensors — our actions can be tracked — sensed and sent wirelessly to a database for storage — even when we are not on the Internet per se — when we are shopping in a store, or when we are playing basketball, or even when we are learning in school.
Take applying IoT to playing basketball — take the National Basketball Association, in fact:
- "The analytics revolution in professional basketball has led to the rapid disappearance of long range two-point shots. … The game itself has changed as a result … In a short period of time … the NBA has been transformed."
Wow! Read that last sentence again:
- "In a short period of time … the NBA has been transformed."
Seriously? OK, we can understand how mining demographic data from Facebook (or Google, or Bing, etc.) can help a company pushing underarm deodorant figure out exactly who will want underarm deodorant, but changing how professional basketball players — who are paid in the millions of dollars — conduct themselves on the court — in short order — seems like a horse of another color. But no, it’s just crunching Really Big Data in both cases.
Well, then, surely using learning analytics — K-12’s version of Really Big Data — should result in profound changes in education — in short order! Here are a few example observations to that effect:
- "Although learning analytics is still a relatively new field in K-12 education, it has the potential to transform American education and help teachers and administrators successfully meet America’s educational challenges identified more than 30 years ago in A Nation at Risk. … Now, though, thanks to student data systems, teachers and administrators have a wealth of valuable information at their fingertips — smart data they can use to make informed decisions."
- "In public education, the promise of data-informed decisions that drive instruction, improve student and school performance, and close achievement gaps appears limitless."
While there is relatively universal agreement that learning analytics are the Holy Grail of K-12, there are some differences of opinion on the actual use of learning analytics in K-12:
- "The use of data analysis to guide the design and deployment of learning experiences is finally reaching widespread adoption."
- "But schools, districts, and most K-12 leadership teams are not close to realizing the kinds of data-driven benefits that already exist in fields like financial services, medicine, and science."
We added the italics to make it easier to see the "some differences." Smilely face goes here.
So much for the view on learning analytics from 30,000 feet! Let’s now drop down to a classroom and see how learning analytics might be used. Take student-student collaboration. In collaborative projects, every teacher asks: what did each student contribute? Here is a golden opportunity for learning analytics to shine — a teacher just needs to see which students did what pieces of the collaborative project. Right? Hold that thought as you read the following little story.
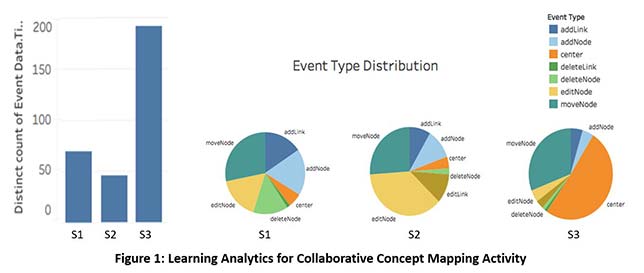
A 6th grade science teacher used Collabrify Map, a web app for concept mapping, one of the free, HTML5 collabrified apps developed by the digital cobblers at the Intergalactic Mobile Learning Center (IMLC), in a collaborative project in her science class. The teacher put three students in each group. In Figure 1, we display the learning analytics for one of the three-person groups. After securing the proper permissions, we turned on the data collection feature of Collabrify Map: a log file containing each key stroke for each student was captured. Here then are some observations based on the data – the learning analytics:
- From the bar graph on the left in Figure 1, Student3 did the most operations on the artifact — the concept map — with Student2 doing the least amount of work — enacting the fewest actions on the concept map.
- Let’s take a closer look; check out the pie-charts that present the specific event types that each of the three students carried out on the artifact. More than 50% of Student3’s actions were to re-center the concept map in the window on the computer screen. In building a concept map, centering the concept map, over and over again, isn’t a particularly meaningful contribution.
- Student2, who contributed the fewest actions on the concept map, however, actually added nodes, edited nodes, added links, edited links — all meaningful contributions to a concept map.
- Now, Student1 added more nodes, edited more nodes, added more links, and edited more links than Student2.
- But wait … While Student2 and Student3 added more nodes, edited more nodes, etc. than Student1, Student1 actually did add nodes to the concept map.
- So, what do all those numbers tell a teacher? Look at the actual concept map itself! The only way for a teacher to really understand who contributed what to the concept map is to look at the concept map, and analyze the nodes and the links and the process that went into the generation of those nodes and links.
Bottom line: The learning analytics per se, displayed in Figure 1, don’t really tell a teacher what each student contributed. Indeed, the numbers are inconclusive, if not deceiving. The teacher must do a "semantic analysis" of the concept map in order to truly understand what each student contributed to that concept map.
Are learning analytics, then, not the Holy Grail of K-12? From one story, such a conclusion can’t be drawn. Data. Big Data. Really Big Data. We just urge caution as our community charges forward.