ISKME Special Series Part 3: Using Data to Improve Instruction
##AUTHORSPLIT##<--->
Are you using the right tests? The correct assessmentmethods? The best technology? These are only a few of theissues that must be addressed in the effort to use data tochange teacher practice.
 SCHOOLS ACROSS THE COUNTRY are collecting and disseminating student achievement data as never before. Local newspapers are displaying test scores and graduation rates on their front pages. Realtors are posting this same information on their Web sites to market the most desirable neighborhoods. And superintendents are creating public relations campaignsaround school report cards.
But despite the clamor over test results, little is known about how such data is being used by teachers to improve student learning—or about the kinds of technology that would make the data more accessible, and thus more able to inform and improve classroom practice.
When Bad Data Happens to Good Teachers
While there are some who argue that good teachers are born and not made, most would agree that teachers must work to develop the skills and practices, subject-matter expertise, and strategies of pedagogy and discipline needed to become successful. Part of this process involves using self-reflective methods to gain a keen understanding of how one is performing. Like a figure skater who watches a video clip of her spins again and again to improve the timing of her jump, so do teachers need to become more precise in understanding what their students have learned, how they have come to learn it, and where gaps in their learning remain.
Most teachers welcome the opportunity to become more effective educators, and look for ways to improve their own teaching practice. But with the dizzying array of state tests, district assessments, and program-specific rubrics, many are at a loss as to how to begin using data to improve their practice.
Within their own classrooms, virtually all teachers use ongoing assessments—some formal, some informal—to determine which students are learning the material. For example, Lori Janiuk, a first-grade teacher at Hunnewell School in Wellesley, MA, says that using data to change instruction should be daily practice. “We do some large-group instruction to introduce all students to a topic,” Janiuk says. “Then we look at the class: Who understood it? Who needs more time on it? This might be done anecdotally or with paper and pencil during observations. Sometimes it’s a formal assessment piece, or sometimes from more of a gut feeling. We then figure out how to re-teach the students who need to stay where they are and how to move others on.”
A key to using data to improve instruction is the ability to think about how to create an intervention or a change in practice. That means that using data is much more than figuring out how to track students; it’s about using assessments for learning, as opposed to assessments of learning. As a result, the most helpful assessments for teachers are those that can help guide instruction to provide individualized learning.
But assessments that miss the mark can frustrate teachers. Margarita Florez, for example, a second-grade teacher at Think College Now in Oakland, CA, says that the assessments used to determine reading skills in early grade levels can be ineffective.“If the questions are just regurgitation from the test,” she says,“you are not getting results that help you improve instruction.You aren’t getting a real snapshot of what a child is doing whenhe is reading. You don’t get at what the missed cues are, so youdon’t know how to change what it is that you do as a teacher.”
Avi Black, history/social science coordinator for the Alameda (CA) County Office of Education, is not happy with tests that provide little or no guidance on how to change classroom practice, pointing out the testing inadequacies in his own subject. “State tests don’t reflect or encourage what history teachers are trying to teach their students,” he says,“which is developing kids’ critical-thinking skills and encouragingthem to use critical inquiry.”
While statewide tests provide important points of comparison, these results are not particularly useful to teachers.“When our statewide test results come out, the principal getsa big printout and we have access to the total results,” Janiuksays. “However, the assessments that I do in the classroom aredirectly linked to curriculum that I am required to teach. Butthe state tests are not linked to what I am teaching per se.”
Black says his office is taking assessment matters into its own hands. “We are getting groups of faculty together to develop a process to create curriculum and then to observe the effectiveness of it in each other’s classrooms,” he says. “This requires going through, step by step, how you question the teacher who did the lesson, and how you study the student work itself.”
The Hows and Whys of UsingData to Improve Teaching
HOW?
- Meet with other teachers regularly to discuss student performance results and share teaching strategies.
- Build trust among others in the use of data by always focusing on how to improve, rather than on who’s not performing.
- Find out what kinds of training and other resources are available to you for using assessment data.
- Engage the principal and your union as advocates for your school’s data needs at the district level.
- Start out with the assessment results and information system that are available, and work to improve and expand them.
- Maintain focus on the goal—improving student performance— and brainstorm with others about how to get there.
WHY?
- To understand more clearly your impact as a teacher.
- To uncover your own beliefs and expectations.
- To understand the needs of each student.
- To provide a context for sharing best practices with other teachers.
- To build cohesive school strategies through grade levels over time.
- To take control of school reform by connecting it to the needs of students.
- To empower parents to participate in their child’s education.
Changing Perceptions
Jon Dickerson, a math teacher at Olathe High School in Montrose, CO, pioneered efforts in his district to encourage teachers to engage with data early on. Says Dickerson, “We would look at what things were successful or unsuccessful, usually by one teacher saying to another, ‘What did you do that made you so successful?’ We made huge strides with that simple idea.” Encouraging teachers wasn’t the problem; getting them to use data was another challenge entirely. Looking for ways to get meaningful results, Dickerson would take each item from the statewide assessment program in math, reading, and writing from grades 3 to 10, and present the data to teachers.
“When teachers first got results back,” he says, “their natural inclination was to identify the social issues such as kids showing up hungry or without any sleep. It’s hard to get teachers out of this type of thinking because there is a culture that surrounds this whole thing. It’s about locus of control: We don’t have control over what is happening outside of the classroom.”
As a teacher on special assignment in the mid 1990s, Dickerson continued to explore what data could do to change these perceptions, by building applications that allowed teachers to manipulate the data in ways that revealed their own preconceived assumptions. “A teacher would say to me, ‘When I teach it in this way, the kids get this,’” Dickerson says. “But then I would have them work with the data so they could see for themselves that only 40 percent of the advanced students got it right. This got them to see past the excuses and start to have a real conversation. Teachers need data that challenges their belief systems. Take that away and they begin to see things that they do have control over. They become much more productive at that point.”
Additionally, like any good continuous learning effort, this process must be part of the ongoing monitoring of results. “It’s one thing to look at a paper report of test results,” Dickerson says. “It’s completely different when you use a computer and can analyze data on the fly. Teachers can write it off if they are only looking at test scores on a piece of paper. The trick is to follow up on that same group of students so you can show impact. If you can show that, then you’re rolling.”
‘Owning’ the Data
There are many ways teachers can use data to improve instruction, including sophisticated Web-based analysis tools or paper-based assessments. It can be done through formal districtwide testing or through informal conversations in the teachers’ room during lunch. There are top-down strategies for mandated data use, as well as bottom-up action research plans that provide teachers with the necessary data to improve their own classroom instruction. Each approach has its own benefits and challenges, yet together they are mutually reinforcing and helping to create a culture of inquiry within schools/education.
Informal data is also an important part of the larger data-use picture in schools, as well as in most other types of organizations. It plays a key role in creating a culture that supports inquiry and continuous learning. “Another huge piece of assessment is those informal conversations with teachers who are either working with the same children, or with those who teach at the same grade level,” Janiuk says. “We use our data that we get from assessments, but then so much is driven by causal conversations that are really meaningful.”
Informal data-gathering meetings can be helpful in that they support the larger vision of improved instruction. “What is different between these meetings is that we have more time in the more formal case,” Janiuk says. “The reason to meet is to make changes if necessary. Just talking in the lunchroom, we never come to a decision. But there are times when you can come together to call your own meeting; in those informal meetings you can decide if [something] really is an issue or not. And it’s likely to be a different group of people than you get at a testing meeting. You get to hear about sisters and brothers and family; more anecdotal information is shared.”
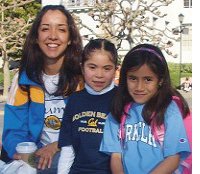
DATA CHAMPION: Margarita Florez “owns”
the data that helps her second-graders.
Dickerson believes that the benefits of using data will only come when teachers feel a sense of possession about the data they use. “People have to own their data,” Dickerson says. “It’s similar to students owning their own learning. If someone tells them something, they don’t own it; students arrive at new learning by a process of investigation. Then they can recreate that process throughout their life, when they need to. Similarly, if teachers are not able to attach meaning to the data with analysis, they won’t see the epiphany in their results. The problem is one of time commitment. [Teachers] have to see that there is value in the commitment, from the beginning. They don’t necessarilysee that, so human motivation is a component.”
Once you’ve gotten teachers on board, how do you build an interface that is intuitive and easy to use, and allows them to investigate their data without having to undergo a lot of training? “We are bombarded with advertisements, mostly from the big assessment companies,” Dickerson says. “I don’t know why they don’t understand what we need or what the barriers are. School districts invest a lot of time and money in data assessment products that aren’t meeting their needs. People get frustrated and end up not using them, which is a step backwards. And once they have a negative experience, they shy away from data analysis.”
Yet the right technology helps teachers see, longitudinally, how certain groups of children are progressing. “You can see where a particular kid is coming in,” Dickerson says. “You can see what you need to do to change the trajectory, and what kinds of events need to happen to change that trajectory. Some products we use allow us to better understand those gaps and what specific curricular exposure is necessary. Anything with a paper report is just not dynamic enough, yet we can’t create technology at the cost of the people resources. Still, we can’t cut out all of the freedom for teachers to learn and explore technology— they have to be learners of technology.”
Getting Parents Involved
Changing practice through the use of data impacts not only classroom learning, but also relationships with parents. “Every first-grader is given a battery of literacy assessments, to see if he qualifies for additional intervention,” Janiuk says. “Parents are either very surprised or not surprised at all to find out that [their child] qualifies. I go through, step by step, with the parents to help them see where the specific issues are. We meet before the child begins the reading intervention, or talk over the phone, andthey get regular updates several times during the year.”
Many teachers use data as a way to increase communication with parents, and as a basis for discussing the student’s issues.“Before Back to School Night, we have a big ‘goals’ meeting,”Janiuk says. “I give parents the results of the assessments, andwe look at individual students and class trends. We look at Excelspreadsheets and I show them samples of student writing. I giveparents the class goals, assessment results, and then what theirchild needs. They see the whole class without student names, sothey can see where their kids are in comparison. It is importantfor them to see that although the results were low in reading, forexample, their child hasn’t had English language instructionbefore. The data gives me something to stick to; something thatI really know; something that we can anchor ourselves to.”
How Schools Can Help
Data-driven instruction has become more prevalent as schools seek to gain a clearer picture of where they are headed and what milestones wait for them along the way. “We set goals for the entire year for our developmental reading assessment and math,” Florez at Think College Now says. “We look at the data midyear to see if we are reaching our goals. We do this teacher by teacher. Some goals we meet midyear, some we don’t. So it makes us think, How are we going to support the goalsthat are most important for us as a school?”
What can schools do to help out? The most successful assistance includes data coaches who get the information and compile it, and others who compile reports and provide analyses of student data. Additionally, giving teachers collaboration time— where they can work with data, put it in spreadsheets, and play with it on the computer— is a first step for those schools that do not have large-scale information systems accessible to teachers. Other schools have analysts at each site who work with teachers to figure out what training and ongoing support is required. Teacher resistance to using data is often accompanied by the belief that it is extra work, as well as by the persistent unease many teachers still feel toward the use of technology. “You have to have somebody in the building who is a data-use champion, or a teacher on special assignment,” Dickerson says. Florez adds,“Some teachers don’t see that the time it takes to set up thespreadsheet is worth it: It will be very useful later.”
Even with all of its challenges and demands, using data to improve instruction—and creating a culture of self-reflection and inquiry at schools—has clear benefits for students, parents, and teachers. Students receive instruction that more closely matches their needs. Parents learn how their children and their school compared on last year’s state assessment but, more importantly, understand how their children are performing now and what they need to improve on. And teachers get to share instructional strategies with other teachers, improving their own practice in the process. They also gain control over the elements of reform that are crucial to improved student success, which, in the end, is what we all want from data.
ISKME Special Series continues
MAY: Indicators & Outcomes in School DistrictsRead each article of the series online as it is postedat www.thejournal.com.
Lisa A. Petrides is president of ISKME.